Why do social metric calculations often go wrong?
Most social metric reporting errors come from definitions, not from bad data. Your headcount, turnover or gender pay gap figure is probably correct for the definition someone used. The problem is that investors, lenders, customers and regulators each define these metrics slightly differently, and the same number is reused for all of them. Social data also sits in systems that were never built for external reporting. Payroll, HR and health and safety records are designed to run the business, not to answer an investor questionnaire or a sustainability standard. Carbon reporting has the GHG Protocol as a common reference. Social metrics have no single equivalent, so the gaps are filled by whoever pulls the data that year.
The result is familiar: figures that change between reports, numbers that do not reconcile with payroll, and an assurance provider asking questions nobody can answer. KEY ESG, an AI-first ESG data platform used by companies and the private equity fund managers that invest in them, sees the same 12 errors again and again. Below they are grouped by topic, with a practical fix for each. A checklist at the end helps you catch them before your report goes out.
What are the most common workforce and headcount errors?
Workforce figures are the denominator for most other social metrics, so an error here spreads into turnover, injury rates and diversity percentages.
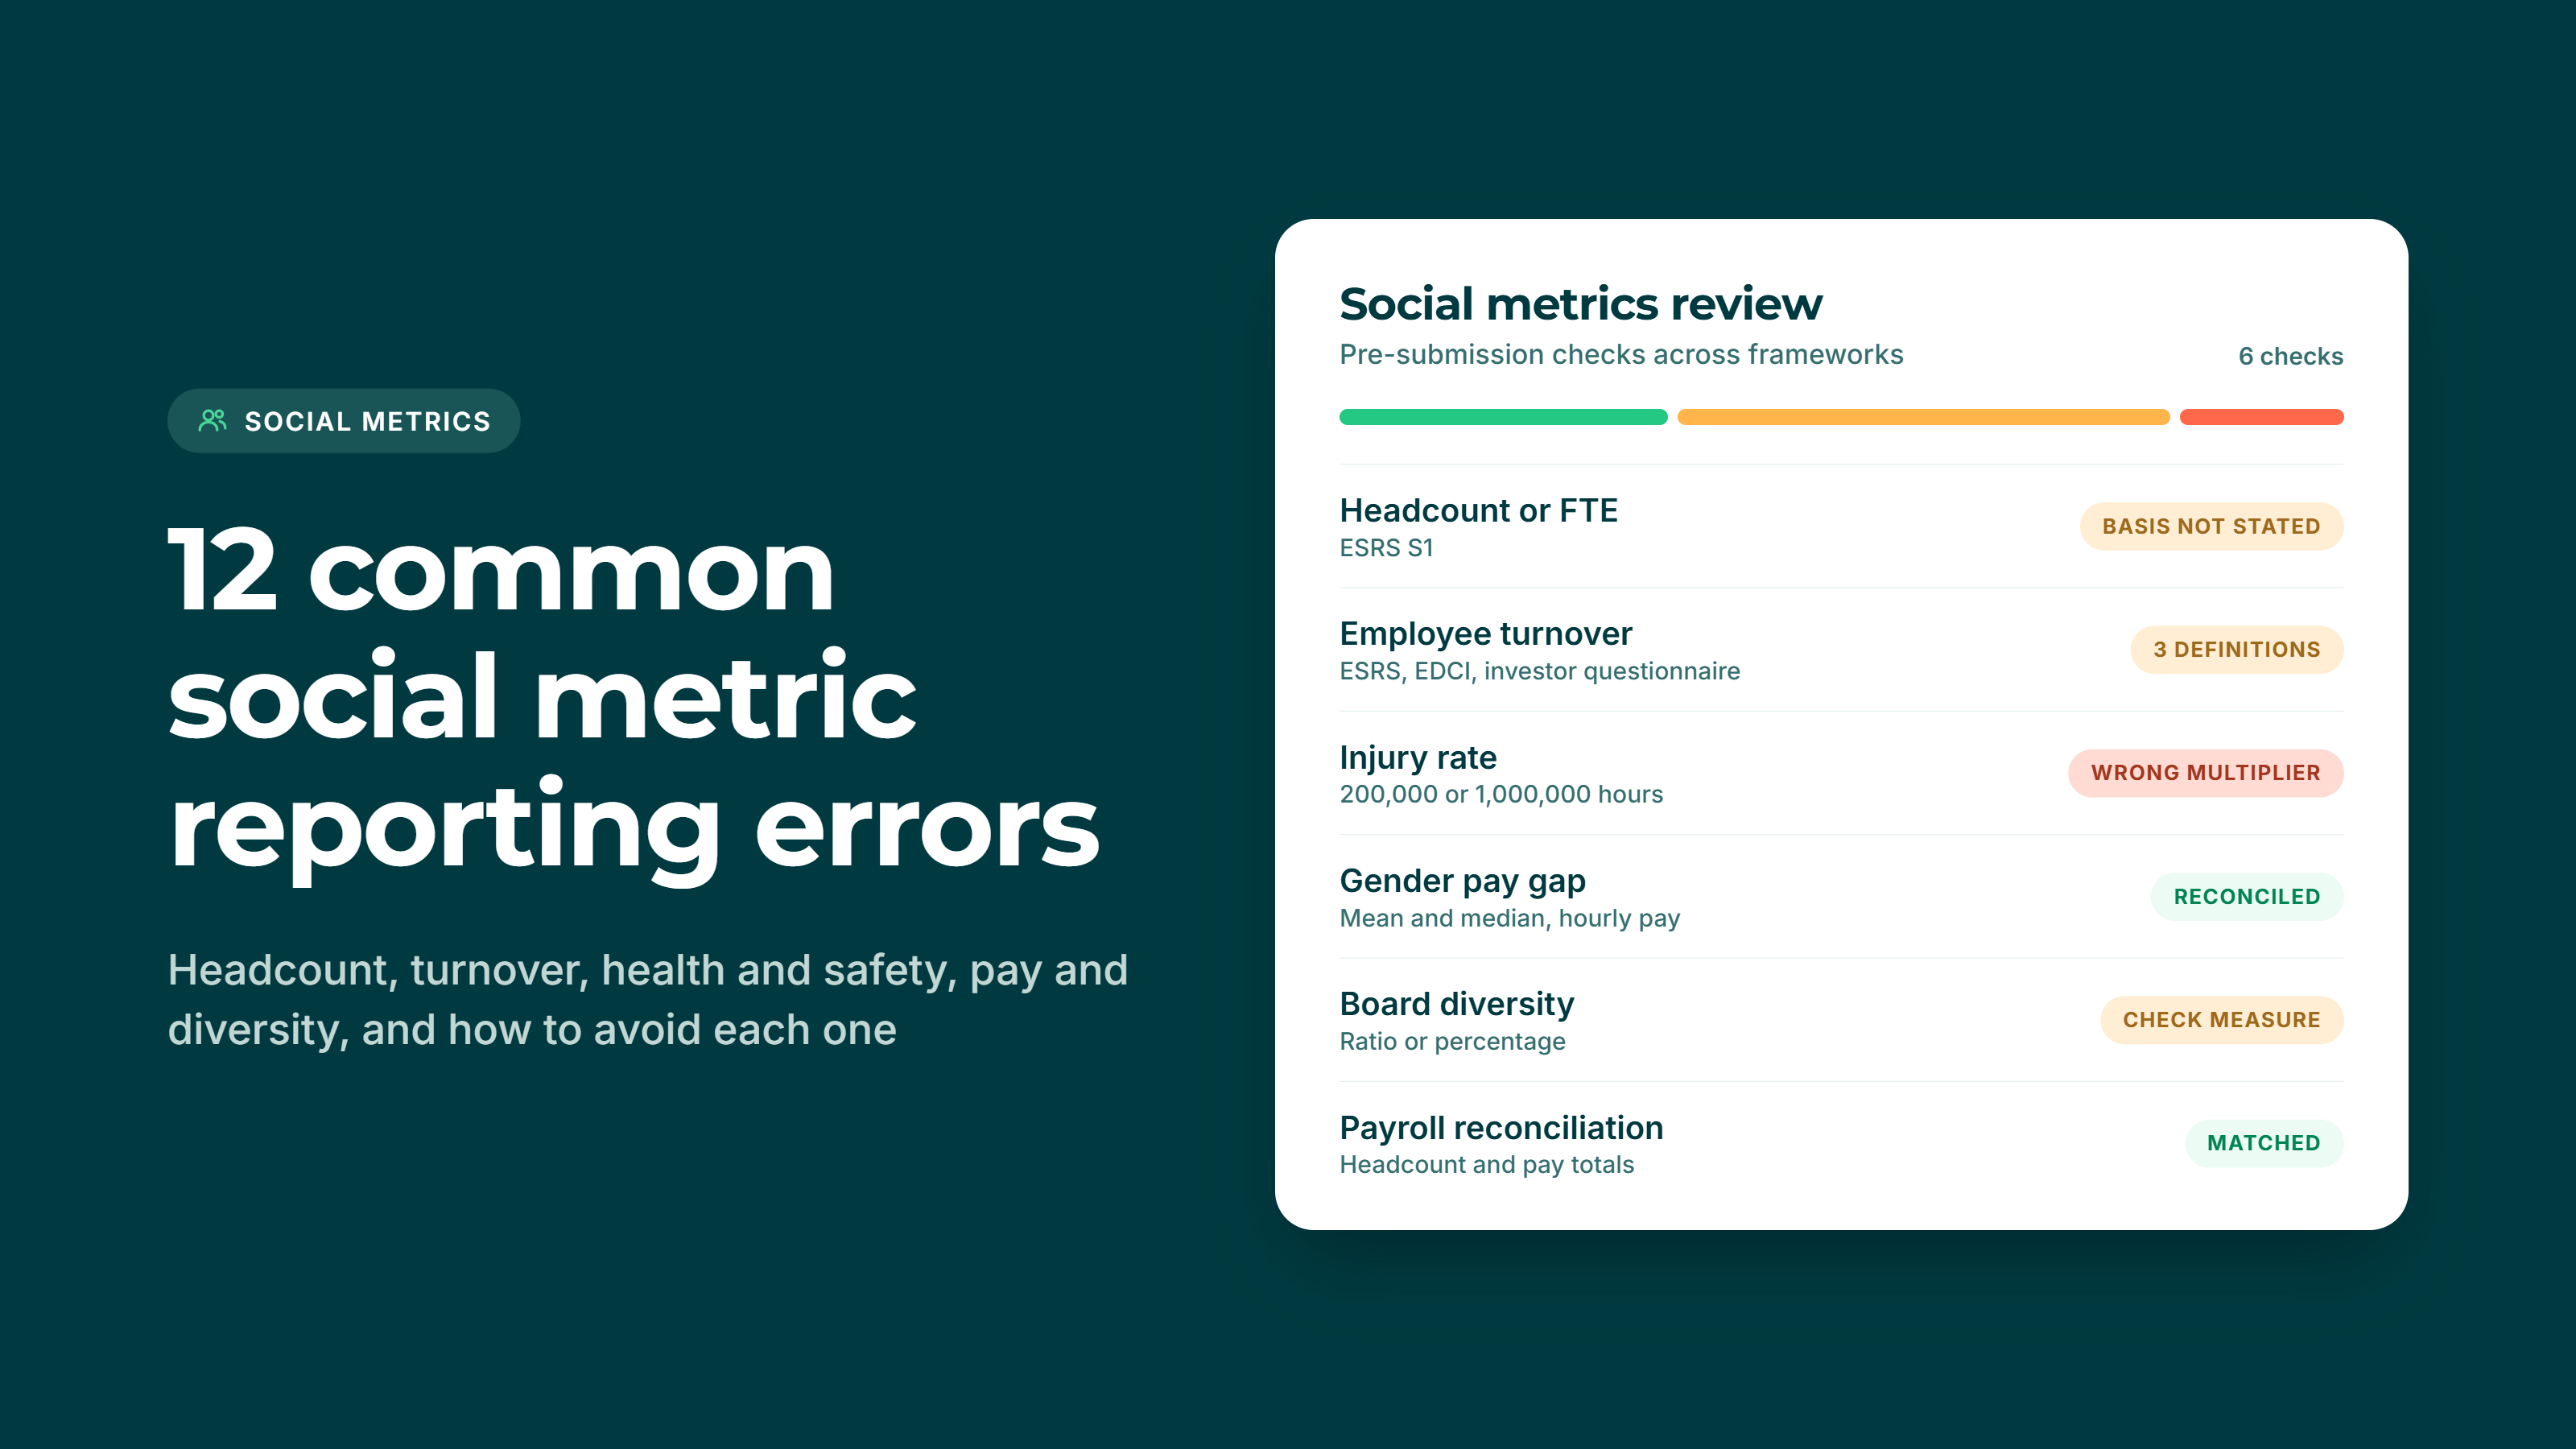
1. Mixing headcount and FTE
What goes wrong: Headcount and full-time equivalents (FTE) are used in the same report, or the basis changes from one year to the next. A company with many part-time staff can show very different turnover or injury rates depending on which one is used.
How to avoid it: Decide which basis each metric uses, write it down, and state it next to the figure. The European Sustainability Reporting Standards (ESRS), for example, let companies report employees as headcount or FTE but require them to say which they used.
2. Using year-end figures where an average is needed
What goes wrong: Year-end headcount is used as the denominator for rate-based metrics such as turnover. For a growing business, this understates turnover. For a shrinking one, it overstates it.
How to avoid it: Check whether each metric asks for a point-in-time figure or an average over the period. Where an average is required, calculate it from monthly or at least quarterly headcount, not from the start and end of year alone.
3. Leaving out non-employees and parts of the group
What goes wrong: Contractors, agency workers and seasonal staff are included in some metrics and excluded from others. Social data often covers only the head office or the main country, while environmental data covers the whole group. ESRS S1 asks for employees and non-employee workers to be reported separately, and many companies cannot split them.
How to avoid it: Use the same reporting boundary as your financial and environmental data. Tag every worker in your source data as employee or non-employee, and disclose any entities or worker groups you could not cover.
Why do turnover and hiring figures not match across reports?
Turnover and hiring figures rarely match across reports because each framework counts leavers and joiners differently.
4. Using one turnover definition for every request
What goes wrong: Some requests want voluntary turnover only, others want all leavers. Fixed-term contracts that end as planned, retirements, redundancies and internal transfers are included in one report and excluded from the next. The ESG Data Convergence Initiative (EDCI), ESRS and most investor questionnaires each word this differently, so a single company can end up with three different turnover figures for the same year.
How to avoid it: Record the reason for every leaver in your HR system using a fixed list of categories. You can then build each framework’s figure from the same underlying data, rather than recalculating from scratch each time.
5. Reporting total headcount change as net new hires
What goes wrong: Companies report the total change in headcount as job creation. If the business made an acquisition during the year, this overstates organic growth. EDCI, which many private equity investors use, asks for organic net new hires separately from the total.
How to avoid it: Track employees who joined through acquisitions separately from direct hires, and keep the date and source of each change. Report both figures where a framework asks for them, and explain any large difference.
What goes wrong in health and safety reporting?
Health and safety errors usually come from the wrong rate formula or incomplete records, and they can make a figure out by a factor of five.
6. Using the wrong multiplier in injury rates
What goes wrong: Injury rates are calculated per a fixed number of hours worked, and the number differs by convention. US OSHA-based rates, such as the Total Recordable Incident Rate (TRIR), use 200,000 hours. ESRS and many European conventions use 1,000,000 hours. Applying the wrong one, or comparing figures that use different multipliers, makes the result meaningless.
How to avoid it: State the formula and multiplier next to every rate you report. If you report to both US and European audiences, calculate both versions from the same incident and hours data.
7. Estimating hours worked and missing incidents
What goes wrong: Hours worked are estimated from contracted hours or headcount instead of being taken from time records. Incidents involving contractors on your sites are left out, and first aid cases are sometimes counted as recordable injuries. A rate of zero at a company with hundreds of employees is more often a sign of weak recording than of a strong safety record, and informed readers will question it.
How to avoid it: Use actual hours from payroll or time systems where possible, and disclose when hours are estimated. Agree a written definition of a recordable incident, apply it to everyone working on your sites, and include contractors where the framework requires it.
Which pay and diversity metrics are most often miscalculated?
The unadjusted gender pay gap is the single most error-prone social metric, followed closely by board diversity and demographic data.
8. Calculating the gender pay gap the wrong way
What goes wrong: Companies use the median when the framework asks for the mean, or the reverse. The UK statutory gender pay gap requires both. The EU Sustainable Finance Disclosure Regulation (SFDR) and ESRS use the average. Other common errors are mixing hourly and annual pay, treating bonuses and allowances inconsistently, and not annualising pay for people who joined or left during the year.
How to avoid it: Calculate from gross hourly pay, write down which pay elements are included, and produce the mean and median from the same dataset. Where the employee group is small, add a sentence of context, because one senior hire can move the figure sharply.
9. Reporting board diversity for the wrong group
What goes wrong: The executive team is reported instead of the board, or non-voting observers are included. Some frameworks ask for the percentage of women on the board, while SFDR asks for the ratio of female to male board members. These give different numbers from the same board.
How to avoid it: Keep a dated list of board members and their roles, and confirm which body and which measure each request asks for before you report.
10. Collecting diversity data without a clear legal basis
What goes wrong: Ethnicity, disability and similar data are collected without a clear lawful basis under GDPR, or in countries where collection is restricted. Figures are then reported without the response rate, so readers cannot judge how representative they are. Gender data held only as male or female also fails to reconcile with headcount when employees choose not to disclose.
How to avoid it: Check the legal position in each country before collecting, make disclosure voluntary, and always report the response rate with the result. Allow for “prefer not to say” and other options in your data model so totals still add up.
What process errors undermine social reporting?
The last two errors are not about any single metric. They are about how social data is governed, and they cause the most rework at assurance stage.
11. Treating a policy as proof of practice
What goes wrong: A company answers “yes” to questions on human rights or ethical conduct because a code of conduct exists. Many frameworks ask something different: whether you monitor compliance and have a working grievance mechanism. SFDR, for example, asks investors whether their investee companies have processes to monitor compliance with the UN Global Compact principles and the OECD Guidelines for Multinational Enterprises. A policy alone does not answer that. The same applies to supply chains, where a modern slavery statement is often the only evidence behind a claim of supplier due diligence.
How to avoid it: For each yes or no answer, keep evidence of how the policy is applied: training records, grievance logs, supplier assessments and follow-up actions. If you cannot point to evidence, answer accurately and describe what is planned.
12. Reusing one number for every framework, with no audit trail
What goes wrong: One person pulls the data from HR and payroll each year, with no written method. The same figure is then sent to an investor, a lender and a customer, each of whom defined the metric differently. When that person leaves, the next year’s figures are calculated another way, and year-on-year trends reflect the change in method rather than real performance. The figures also often fail to reconcile with payroll, which is one of the first checks an assurance provider makes.
How to avoid it: Keep one source dataset, and write down the definition and calculation for each metric under each framework you report to. Link every reported figure back to its source, reconcile headcount and pay totals with payroll before submission, and restate or flag prior years when a method changes.
Social metrics checklist: what to check before you submit
Run through these checks before any social figures leave the business.
- Each metric states whether it uses headcount or FTE, and the basis matches last year
- Rate-based metrics use the denominator the framework asks for: average or point in time
- The reporting boundary matches your financial and environmental data, and any gaps are disclosed
- Employees and non-employee workers are reported separately where required
- Turnover uses the leaver categories the specific framework defines
- Net new hires separate organic hiring from acquisitions
- Every injury rate shows its formula and multiplier (200,000 or 1,000,000 hours)
- Hours worked come from time or payroll records, or are disclosed as estimates
- Contractor incidents on your sites are included where required
- Gender pay gap uses hourly pay, the right measure (mean, median or both) and a documented list of pay elements
- Board diversity covers the board, not the executive team, and uses the measure requested (ratio or percentage)
- Diversity data has a lawful basis, and response rates are reported with results
- Every yes or no answer on policies is backed by evidence of how the policy is applied
- Headcount and pay totals reconcile with payroll
- Prior years are restated or flagged where a method has changed
- The definition and calculation for each metric are written down for the next person
Frequently asked questions
What are social metrics in ESG reporting?
Social metrics measure how a company affects its workforce, the people in its supply chain and the communities it operates in. Common examples are headcount, employee turnover, injury rates, the gender pay gap, board diversity, training hours and human rights due diligence.
Why do social metrics differ between frameworks?
There is no single global standard for social metrics, unlike the GHG Protocol for carbon. ESRS, SFDR, EDCI, national rules such as UK gender pay gap reporting, and individual investor questionnaires each define metrics in their own way. A turnover or pay gap figure can therefore be correct for one framework and wrong for another.
What is the most common social metric reporting error?
Reusing one figure for every framework is the most common error. It causes inconsistent numbers across reports for the same year, even when the source data is correct.
Do social metrics need to be assured?
Under the EU Corporate Sustainability Reporting Directive (CSRD), companies in scope must obtain limited assurance on their sustainability statement, which includes social disclosures. Outside CSRD, assurance is voluntary, but investors and lenders increasingly ask for it.
How KEY ESG helps
KEY ESG is an AI-first ESG data platform that helps companies, and the private equity fund managers that invest in them, collect, manage and report sustainability data in one place. Social data is collected once against clear definitions, and the platform produces each framework’s version of a metric from that single dataset, so your turnover, pay gap and injury rates stay consistent wherever they are reported. Every figure links back to its source, which gives your team and your assurance provider a clear audit trail year after year.
Book a 30-minute call with our team here to review your social metrics against this checklist before your next reporting cycle