Why do environmental reporting errors happen so often?
If your emissions figures change every year and you cannot tell whether the change is real or the result of a calculation issue, the cause is rarely missing data. Most environmental reporting errors come from boundaries, units and emission factors. A company can have every utility invoice and fuel receipt it needs and still report a carbon footprint that is wrong by a wide margin, because one site was converted in the wrong unit or an outdated factor was applied.
The Greenhouse Gas (GHG) Protocol gives carbon reporting a common framework, but it leaves many choices to the reporting company: which control approach to use, which emission factors to apply, how to estimate Scope 3 and when to recalculate a base year. When those choices are not written down, they change from year to year with whoever prepares the data.
The result is familiar: emissions that move sharply without any operational reason, Scope 2 figures that cannot be traced to evidence, and Scope 3 numbers nobody is confident defending. KEY ESG is an AI-first environmental, social and governance (ESG) data platform used by companies and the private equity fund managers that invest in them. Across the thousands of data submissions made in our platform each year, the same 12 errors come up again and again. Below they are grouped by topic, with a practical fix for each, followed by a checklist to run before you submit.
What are the most common carbon accounting errors in boundaries, units and emission factors?
These three errors sit underneath every scope, so getting them right first prevents mistakes from spreading through the whole footprint.
1. An undefined or inconsistent organisational boundary
What goes wrong: The GHG Protocol lets companies set their boundary using operational control, financial control or equity share. Many companies never state which one they use, or apply different approaches to different entities. Acquisitions and disposals during the year are also missed, so the emissions boundary no longer matches the financial consolidation.
How to avoid it: Choose one consolidation approach, document it, and state it in your report. Keep a list of every entity and site in scope, and update it whenever the group structure changes.
2. Unit and conversion errors
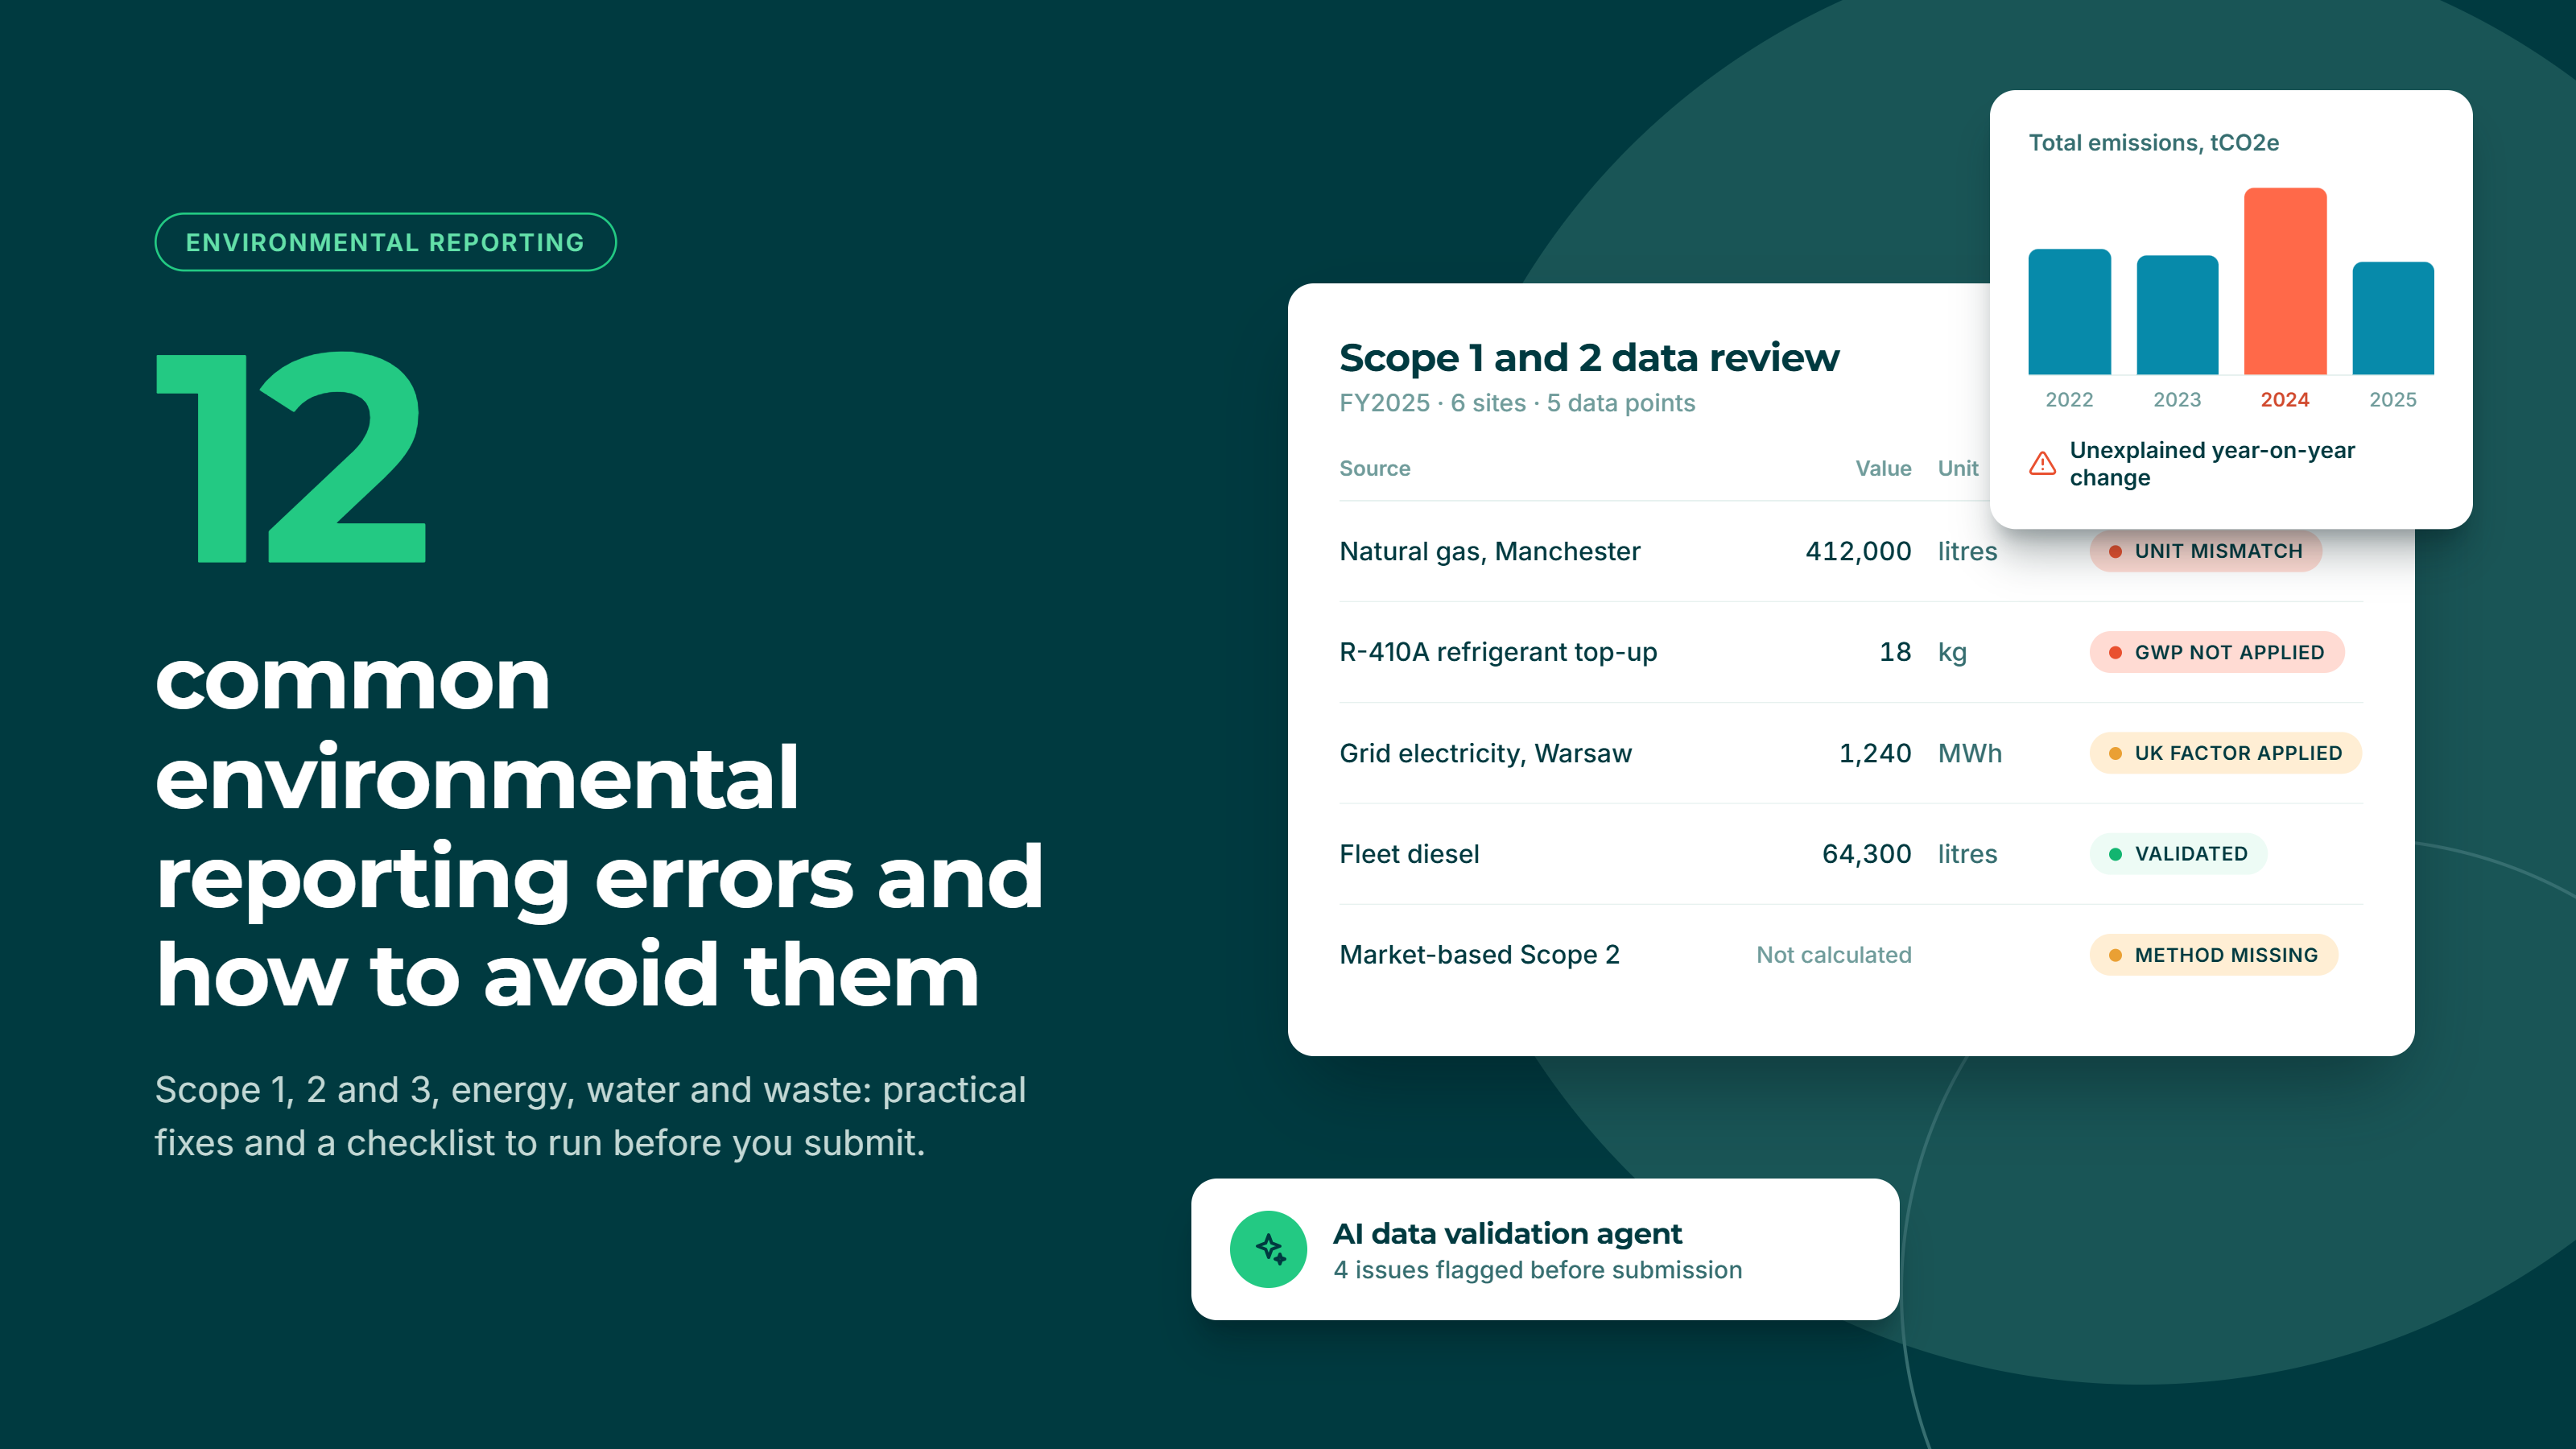
What goes wrong: Fuel is entered in litres when the factor expects kilowatt hours, kilograms are confused with tonnes, and gross and net calorific values are mixed. Companies with US operations face additional units: natural gas billed in therms or million British thermal units (MMBtu), fuel measured in US gallons, which differ from imperial gallons, and weights in short tons or pounds rather than metric tonnes. US factors, such as those in the Environmental Protection Agency (EPA) Emission Factors Hub, are often expressed per MMBtu, per gallon or per short ton, and grid electricity factors in pounds per megawatt hour, while UK and EU factors are mostly per kilowatt hour or per tonne. The US also refers to gross calorific value as higher heating value (HHV). Refrigerant top-ups are reported in kilograms of gas without applying the gas’s global warming potential (GWP), which for common refrigerants can be in the thousands. These are the errors most likely to make a figure wrong by an order of magnitude.
How to avoid it: Record the unit with every data point, convert in one controlled place rather than in each spreadsheet, and check that each factor matches the unit and calorific basis of the data it is applied to. If you operate in both the US and Europe, choose one unit system for the footprint and convert all data into it before applying factors. Compare each site’s figures with the previous year and investigate any large swing.
3. Outdated or mismatched emission factors
What goes wrong: Factors from the wrong year or the wrong country are applied, such as UK factors for operations in Poland. Some factors cover carbon dioxide only when the report requires carbon dioxide equivalent (CO2e), and GWP values from different Intergovernmental Panel on Climate Change (IPCC) assessment reports are mixed within one footprint.
How to avoid it: Keep a factor register that records the source, year, geography and GWP basis for every factor you use. Update it once a year, and apply country-specific factors wherever operations sit outside your home market.
What goes wrong in Scope 1 and Scope 2 reporting?
The most frequent Scope 1 and 2 errors are missing emission sources and Scope 2 figures that are incomplete or not backed by evidence. Scope 1 covers direct emissions from sources a company owns or controls. Scope 2 covers emissions from the electricity, heat and steam it buys. Both are usually well documented, yet they still carry some of the most frequent errors.
4. Missing Scope 1 sources
What goes wrong: Gas and fleet fuel are reported, but refrigerant leakage from air conditioning and refrigeration, backup generators and company-owned cars are left out. Leased buildings and vehicles are placed in the wrong scope because the consolidation approach was not applied consistently.
How to avoid it: Run a source inventory for every site: combustion, vehicles, refrigeration and air conditioning, and any process emissions. Ask facilities teams for service records showing refrigerant top-ups, and decide how leased assets are treated under your chosen consolidation approach.
5. Reporting only one Scope 2 method
What goes wrong: The GHG Protocol Scope 2 Guidance requires dual reporting: a location-based figure using average grid factors and a market-based figure reflecting the electricity contracts a company has chosen. Many companies report only one. Others calculate the market-based figure with grid average factors instead of a supplier-specific or residual mix factor, which understates emissions where renewable electricity has already been claimed by others.
How to avoid it: Calculate both figures every year. For the market-based figure, use the hierarchy set out in the guidance: contractual instruments first, then supplier-specific factors, then residual mix factors where available. The GHG Protocol is currently revising its Scope 2 Guidance, and the proposals include stricter rules for market-based claims, such as matching renewable electricity purchases to consumption on an hourly basis. Until the revised guidance is published, the 2015 version remains the one to follow, but it is worth tracking the changes now.
6. Renewable electricity claims without valid evidence
What goes wrong: A company reports zero market-based Scope 2 emissions because its supplier markets a green tariff, without holding the energy attribute certificates behind it. Certificates are claimed from the wrong country or period, or the same certificates are counted by more than one entity.
How to avoid it: Hold evidence for every renewable claim: Renewable Energy Guarantees of Origin (REGOs) in the UK, Guarantees of Origin (GOs) in the EU, or the relevant power purchase agreement. Check that each instrument matches the market, the reporting period and the volume you claim.
Why are Scope 3 emissions so hard to get right?
Scope 3 covers all other indirect emissions in a company’s value chain, from purchased goods to business travel and the use of sold products. It is also the least precise part of a footprint. For many companies, particularly in services, retail and other asset-light sectors, it is the largest part too, so errors here can have the biggest effect on the total. For energy-intensive businesses such as steel, cement or chemicals manufacturers, Scope 1 usually dominates instead, and errors in fuel and process emissions matter most.
7. Incomplete screening of the 15 categories
What goes wrong: Companies report business travel and employee commuting, because the data is easy to find, and stop there. Larger categories such as purchased goods and services, or the use of sold products, are left out without any explanation. Readers then cannot tell whether a category was assessed and found immaterial or simply never looked at.
How to avoid it: Screen all 15 categories in the GHG Protocol Scope 3 Standard at least once, record the result, and explain every exclusion. Always state clearly which of the 15 categories your reported Scope 3 figure covers, so readers can compare it with previous years and with other companies. Focus measurement effort on the categories that make up most of your footprint.
8. Spend-based estimates that are never adjusted or improved
What goes wrong: Spend-based methods multiply what a company spends by an emissions factor per pound or euro. They are a reasonable starting point, but errors arise when the factors are years old, the currency differs from the factor’s currency, or inflation is not taken into account. Because emissions rise and fall with spending, a price increase can look like an increase in emissions, and a supplier discount can look like a reduction.
How to avoid it: Match the currency and price year of your spend data to the factor, and adjust for inflation where needed. Over time, replace spend-based estimates for your largest suppliers and categories with activity data or supplier-specific emissions.
9. Double counting between categories
What goes wrong: The same emissions are counted twice, for example when capital equipment appears in both purchased goods and capital goods, or when transport costs included in a supplier’s invoice are also counted under upstream transportation. Emissions already reported in Scope 1 or 2, such as fuel for company-owned vehicles, also turn up again in Scope 3.
How to avoid it: Map each spend or activity line to one category only, using a documented set of rules. Check Scope 3 data against Scope 1 and 2 sources before you finalise the total.
What other environmental and process errors should you look out for?
The last three errors cover environmental data beyond carbon and the way the whole dataset is governed. They are the ones most likely to surface at assurance stage.
10. Incomplete energy, water and waste data
What goes wrong: Energy consumption is reported for sites with their own meters but not for shared offices, where usage is included in the service charge. Water figures are taken from bills that combine supply and wastewater, and waste is estimated from the number of bins collected rather than weighed. Renewable energy percentages are calculated on electricity only when the framework asks for total energy.
How to avoid it: Use the same site list for energy, water and waste as for emissions. Ask landlords and waste contractors for actual consumption and tonnage data, and disclose where figures are estimated or allocated by floor area.
11. No base year or recalculation policy
What goes wrong: A company sets a reduction target against a base year but has no rule for when to restate it. After an acquisition, a disposal or a methodology improvement, emissions appear to rise or fall even though nothing has changed in operations. Progress against targets then becomes impossible to assess.
How to avoid it: Write a recalculation policy that sets out which changes trigger a restatement and the significance threshold you apply. Many companies use 5%, the threshold the Science Based Targets initiative (SBTi) applies to target recalculation. Restate the base year when the policy is triggered and explain the change in your report.
12. Undisclosed estimates and no audit trail
What goes wrong: Missing months or sites are filled in by extrapolation, which is acceptable, but nobody records which figures are estimated or how. Reported totals cannot be traced back to invoices, meter readings or supplier data, and they do not reconcile with energy and fuel costs in the accounts. If the person who prepared the data leaves the company, it is often unclear how the figures were calculated.
How to avoid it: Flag every estimate and record the method used. Link each reported figure to its source evidence, compare energy and fuel spend with the finance ledger before submission, and write down the calculation approach so it can be repeated next year.
Run through these checks before any environmental figures leave the business.
- The consolidation approach is stated and applied to every entity
- The entity and site list reflects acquisitions and disposals during the year
- Every data point has a unit, and conversions happen in one controlled place
- Refrigerant top-ups are converted using the gas’s GWP
- Every emission factor has a recorded source, year, geography and GWP basis
- Scope 1 includes refrigerants, generators and company vehicles
- Scope 2 is reported on both a location-based and a market-based basis
- The market-based figure uses contractual instruments, supplier factors or residual mix factors
- Every renewable electricity claim is backed by certificates or a power purchase agreement
- All 15 Scope 3 categories are screened, the categories included in the total are stated, and exclusions are explained
- Spend-based factors match the currency and price year of your spend data
- No emissions are counted in more than one Scope 3 category or scope
- Energy, water and waste cover the same sites as emissions
- A base year recalculation policy is written down and applied
- Estimates are flagged, with the method recorded
- Energy and fuel figures reconcile with the finance ledger
Frequently asked questions
What is the difference between Scope 1, 2 and 3 emissions?
Scope 1 emissions come directly from sources a company owns or controls, such as boilers, vehicles and refrigeration. Scope 2 emissions come from the generation of electricity, heat or steam the company buys. Scope 3 covers all other indirect emissions across the value chain, grouped into 15 categories in the GHG Protocol Scope 3 Standard.
What is the difference between location-based and market-based Scope 2?
The location-based method uses the average emissions intensity of the grid where electricity is consumed. The market-based method reflects the electricity a company has chosen to buy, using contracts and certificates. The GHG Protocol requires companies to report both.
Do I need to report Scope 3 emissions?
It depends on the framework. The European Sustainability Reporting Standards (ESRS) under the Corporate Sustainability Reporting Directive (CSRD) require Scope 3 reporting for companies in scope. Since the Omnibus I simplification package entered into force in March 2026, the CSRD applies only to EU companies with more than 1,000 employees and more than €450 million in net turnover, but many investors, lenders and customers still ask smaller companies for Scope 3 data. Even where it is voluntary, screening all 15 categories shows where your largest emissions sit.
What is the most common environmental reporting error?
Unit and emission factor errors are the most common, and they have the largest effect on the total. A single fuel or refrigerant entry in the wrong unit can outweigh every other line in the footprint.
How KEY ESG helps
KEY ESG is an AI-first ESG data platform that helps companies, and the private equity fund managers that invest in them, collect, manage and report sustainability data in one place. Carbon accounting is built into the platform, so Scope 1, 2 and 3 emissions are calculated consistently across every entity and site. The platform is also designed to prevent the errors in this article from entering your reporting, and to help you find and fix them quickly if they do.
Built-in data validation checks review your data as it is entered, so issues are flagged before they reach your report. Clear guidance sits alongside every question, explaining what to include and how to provide the data, and our team offers in-platform support at every step of the data collection process.
Everyone who contributes to your data collection receives annual training on the methodology and the most common mistakes, so the same errors are not repeated from one reporting cycle to the next.
If an error still makes its way into your data, our AI data validation agent, which has been trained to spot the common mistakes described in this article, flags it for review. This helps your team identify the root cause quickly and resolve it.
Book a 30-minute call with our team to review your environmental data against this checklist before your next reporting cycle here.